May 10, 2024
Low for long? Reasons for the recent decline in productivity
Over the first two decades of the currency union, labour productivity (output per worker) in the euro area has been weak, at least when compared to other advanced economies. While productivity grew annually on average by 0.6 percent from 1999 to 2019, the average pace was more than twice as fast in the United States. Productivity somewhat recovered after the pandemic, but more recently the picture changed for the worse again: In 2023, productivity in the eurozone fell by almost 1 percent while it grew by 0.5 percent in the US. We discuss the drivers of recent weak productivity growth, how it might develop and what that all means for disinflation in the euro area.
Labour productivity moves with the cycle
Some structural factors can change productivity growth. In recent times, the unexpectedly quick adoption of digital technologies during the pandemic may have pushed up productivity growth. By contrast, some external shocks, such as the severe disruption in energy markets that followed the Russian invasion of Ukraine could have weighed on it.
While it is too early to ascertain the impact of these structural factors on productivity, the recent weak economic activity is likely to have dragged it down. Indeed, productivity in the euro area typically moves quite strongly with the business cycle. During times of slow or negative economic growth, labour productivity tends to be muted as well, and it rises as the economy recovers (Chart 1).
Chart 1
Cyclicality of labour productivity
Percentage deviations from trend
Source: Eurostat, CEPR and ECB staff calculations. Notes: The cyclical component is identified with the approximate bandpass filter of Christiano and Fitzgerald (2003), identifying the business cycles between 6 and 32 quarters, and is expressed in percent deviations from trend. Peaks and troughs are taken from the CEPR chronology of euro area business cycles.
This cyclical pattern of labour productivity results from the strategy of many firms to hold on to workers even at times of dire prospects. As it can be very costly to let workers go and then rehire and retrain them when things brighten up again, hoarding labour in bad times is a rather common practice among firms. To some extent, this obeys to various European-specific labour market institutions and social preferences that give particular prominence to employment protection compared to flexibility. These preferences were also mirrored in the government-sponsored job retention schemes, as seen massively during the pandemic, which may also exacerbate the cyclical ups and downs in productivity. Recent research by ECB staff, in fact, reveals that the share of firms hoarding labour was significantly elevated during the pandemic and post-pandemic period.[1]
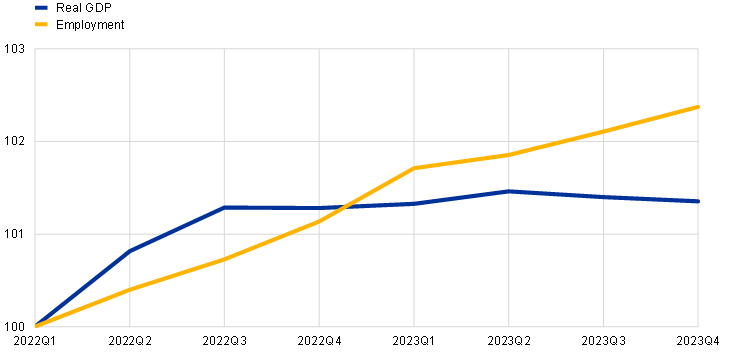
Moreover, in the last quarters, a number of factors may have even amplified the cyclical decline of labour productivity, reinforcing an unusual combination of a thriving job market and weak economic activity (Chart 2).
Chart 2
Employment and real GDP

Source: Eurostat and ECB staff calculations.
What amplifies the ups and downs of productivity?
First, the increase of profit margins in 2022/23 enabled firms to hold on to their employees despite falling revenues for longer than usual. In other words, high profit margins created financial space for firms to hoard labour. Recent ECB analysis based on a sample 2014-2023 suggests that an increase in a firm’s profit margin by 1 percentage point increases the likelihood of labour hoarding by 0.2 percentage points.[2]
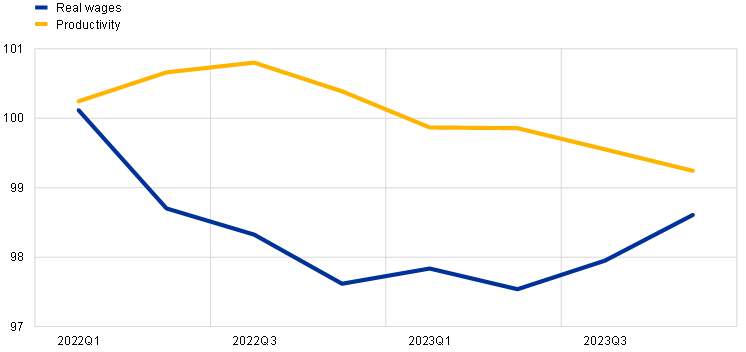
Second, hiring workers became less costly in 2022/23, as real wages fell significantly. When inflation rates peaked in 2022, wage increases didn’t keep up with rising price levels. Only with a time lag nominal wage increased and inflation rates fell, so that real wages started to rise. While productivity growth has also been weak since the onset of the recent inflationary burst, real wages fell significantly more (Chart 3). The resulting gap between real wages and productivity pushed down real labour costs. Then, as the wage-productivity gap persisted, the incentives for firms to hire more workers rose. And this weighed on the average productivity per worker.[3]
Chart 3
Productivity real wage gap

Source: Eurostat and ECB calculations. Notes: wages are deflated with the private consumption deflator. A similar, albeit somewhat smaller gap emerges using the GDP deflator.
Third, the unusually strong labour force growth in the post-pandemic period helped firms to get new workers on board to address actual or expected labour shortages. Firms throughout all sectors of the economy reported increasing shortage of workers during last years (Chart 4). This has been a result of reviving demand after the pandemic but also of a more structural lack of labour supply, given the increasingly ageing population and skill gaps in many professions. At the same time, the labour force grew strongly after the pandemic (Chart 4). On the one hand, a large share of the previously inactive domestic population joined the labour force, for instance senior workers. On the other hand, the euro area labour supply benefited from strong immigration. Amid the possibility of facing acute labour shortages, firms hired much of the additional workers available, even though this happened during a time of overall subdued economic activity. As this sort of precautionary motive for hiring workers strengthened, firms likely accepted some productivity losses as a lesser disadvantage.
Chart 4
Labour force growth (LHS) and labour shortages (RHS)
(percentages)
Source: Eurostat, European Commission and ECB staff calculations. The labour shortages question is based on the survey question: “What main factors are currently limiting your production?”. Labour shortages are aggregated from manufacturing, construction, and service sector indices by using employment weights for each sector.
Fourth, lower average hours worked per person led companies to hire some additional workers to keep their labour input overall unchanged. An average person employed in the euro area worked five hours less per quarter at the end of 2023 compared to before the pandemic. This is equivalent to around 2 million full-time workers. A large part of this decline in hours has certainly been compensated at the firm-level, such as by improving processes, reducing some slack or maybe non-registered overtime. But it is plausible that firms had to step up hiring new workers to some extent to make up for the lower average hours worked. As this happened, comparing to before the pandemic, productivity per worker dropped by 0.8 percent, while productivity per hour increased by 0.6 percent over the same time.
A cyclical recovery in productivity will support disinflation
The factors described above have supported the buoyant job creation since the end of 2022. However, they are likely to provide weaker tailwinds going ahead, which in turn will support the increase in productivity. First, profit margins are already adjusting and are expected to further decline with firms absorbing the increase in nominal wages. This will reduce the firms’ financial space for hoarding employment. Second, as real wages continue to recover (Chart 3), the gap between productivity and real wage growth is closing. As a consequence, employment gets relatively more expensive, and this will be pushing down new vacancies. Third, labour shortages have come down recently, reducing the pressure to find more workers. Moreover, the labour force is likely to grow less strongly going forward, as the pool of still inactive population that could be activated has declined considerably. Fourth, while some full-time employees want to work fewer hours, this is to some extent offset by part time workers aiming to work more. In other words, the downward trend of average hours worked is likely to continue, but at a slower pace. Hence, the need for more jobs to compensate for fewer average hours worked might not continue to the same degree as it did in previous decades.
For all these reasons, labour productivity is likely to be pushed up, in addition to the usual cyclical push from the projected economic recovery. A moderate nominal wage growth path in combination with stronger productivity growth would then soften cost pressures of firms. Together with lower profit margins, this would further support the disinflation process in the euro area.
This process is implicit in the latest ECB staff macroeconomic projections. But the recovery of productivity growth should not be interpreted as an unconditional prediction; not the least because some forces unchained by the large shocks of the last four years may still alter its course in ways that are not identifiable yet.
Source: European Central Bank
Legal Notice: The information in this article is intended for information purposes only. It is not intended for professional information purposes specific to a person or an institution. Every institution has different requirements because of its own circumstances even though they bear a resemblance to each other. Consequently, it is your interest to consult on an expert before taking a decision based on information stated in this article and putting into practice. Neither Karen Audit nor related person or institutions are not responsible for any damages or losses that might occur in consequence of the use of the information in this article by private or formal, real or legal person and institutions.


