March 15, 2024
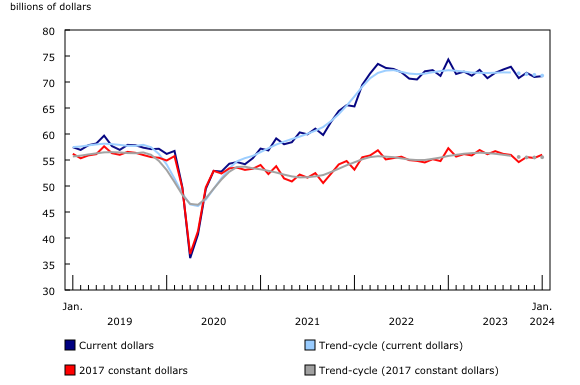
Manufacturing sales rose 0.2% to $71.1 billion in January, on higher sales in 11 of the 21 subsectors, led by the transportation equipment (+4.3%) and chemical (+3.5%) subsectors. The aerospace product and parts industry group (-16.7%) posted the largest decline.
Sales in constant dollars rose 1.1% in January, while the Industrial Product Price Index edged down 0.1%.
Motor vehicle and chemical sales lead increase in January
Following five consecutive monthly declines, sales in the motor vehicle industry group rose 19.6% to $5.3 billion in January. Production resumed in some auto assembly plants in January, after several months of downtime for retooling in 2023. Year over year, sales of motor vehicles were up 7.7% in January, while exports of motor vehicles and parts rose 1.6%.
Sales of chemical products rose 3.5% from December to $5.6 billion in January, on widespread gains in six of the seven industry groups, led by pesticide, fertilizer and other agricultural chemical manufacturing (+68.1%). Despite the monthly increase, total sales of chemical products declined 2.2% year over year in January.
Production in the aerospace product and parts industry group posted the largest monthly decrease, declining 16.7% to $2.1 billion in January. The decline in January followed the largest production on record of aerospace products in December. Exports of aircraft, aircraft engines and aircraft parts decreased 15.2% in January.
Ontario posts the largest sales increase
Manufacturing sales increased in seven provinces in January, led by Ontario and New Brunswick. Sales in Quebec posted the largest decline.
Sales in Ontario rose 3.8% to $32.2 billion in January, led by higher sales of motor vehicles (+21.8%) and chemical products (+10.1%). The gains were partially offset by a 3.7% decline in sales of petroleum and coal products. Motor vehicle manufacturing also contributed to the higher sales in Windsor (+59.6%) and Toronto (+1.5%) in January.
In New Brunswick, sales increased 4.2% to $2.1 billion in January, largely on higher sales of non-durable goods (+5.4%). Despite the increase during the month, total sales in New Brunswick were down 6.1% on a year-over-year basis in January.
In Quebec, sales fell 4.2% from December to $17.3 billion in January, following two consecutive monthly increases. Lower production of aerospace product and parts (-20.6%) as well as lower sales of primary metals (-8.6%) were mainly responsible for this decline. The aerospace product and part industry group also contributed to a decline in total sales in Montréal (-4.2%) in January.
Total inventories decline
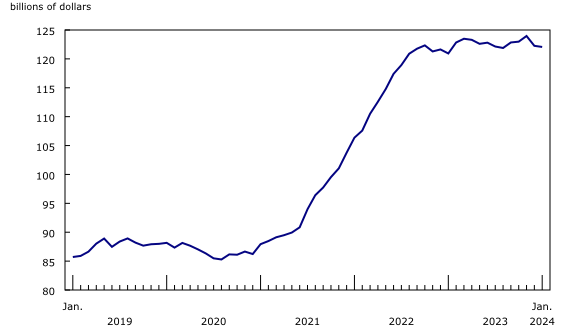
Total inventories decreased 0.2% to $122.1 billion in January, following a 1.4% decline in December, due to lower raw material inventories (-1.2%). Lower inventories of primary metals (-4.2%) and petroleum and coal (-4.5%) were mainly responsible for the decline.
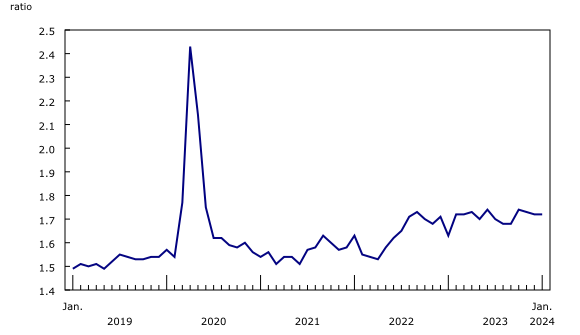
The inventory-to-sales ratio was unchanged, at 1.72 in January. This ratio measures the time, in months, that would be required to exhaust inventories if sales were to remain at their current level.
Unfilled orders decrease
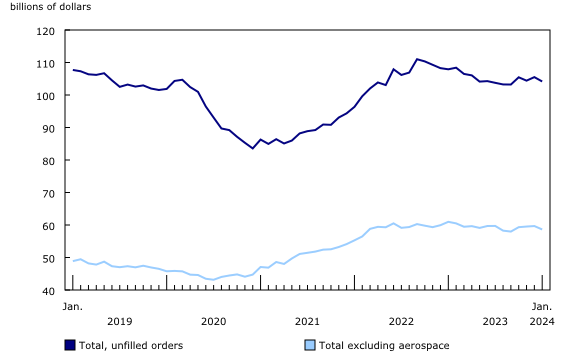
The total value of unfilled orders declined 1.3% to $104.2 billion in January, largely on a 2.2% decrease in unfilled orders of transportation equipment.
Capacity utilization rate increases
The capacity utilization rate (not seasonally adjusted) for the total manufacturing sector increased from 75.1% in December to 77.1% in January, mainly on higher production.
Capacity utilization rates increased in the chemical (+7.5 percentage points) and transportation equipment (+3.7 percentage points) subsectors. The gains were partly offset by lower capacity utilization rates in the non-metallic mineral (-7.1 percentage points) and computer and electronic product (-6.1 percentage points) subsectors.
Source: Statistics Canada
Legal Notice: The information in this article is intended for information purposes only. It is not intended for professional information purposes specific to a person or an institution. Every institution has different requirements because of its own circumstances even though they bear a resemblance to each other. Consequently, it is your interest to consult on an expert before taking a decision based on information stated in this article and putting into practice. Neither Karen Audit nor related person or institutions are not responsible for any damages or losses that might occur in consequence of the use of the information in this article by private or formal, real or legal person and institutions.


