September 30, 2022
Employment rate up, labour market slack down in the EU
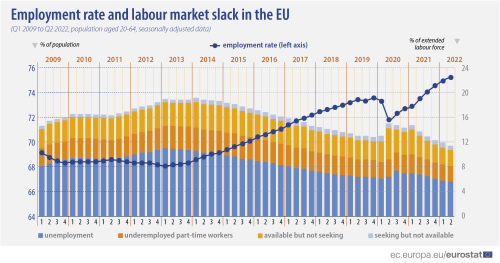
In the second quarter of 2022, 193.9 million persons in the EU were employed. The EU seasonally adjusted employment rate for people aged 20-64 stood at 74.8 %, up by 0.3 percentage points (p.p.) from 74.5 % in the first quarter of 2022 as shown in Figure 1.
At the same time, seasonally adjusted total labour market slack in the EU, consisting of unmet need for work, amounted to 24.4 million persons, which represented 11.5 % of the extended labour force in the second quarter of 2022, down from 11.9 % in the first quarter of 2022 (-0.4 p.p.). Concerning its main component, unemployment, 12.0 million persons were unemployed in the second quarter of 2022 and the EU seasonally adjusted unemployment rate was 5.8 %, 0.2 p.p. lower than in the first quarter of 2022 when it was 6.0 %. Underemployed part-time workers were 2.5 % (-0.1 p.p.), those available for work but not searching for work were 2.6 % (-0.1 p.p.) and those actively searching for work but not available to take up work were 0.7 % (-0.1 p.p.), all in percentage of the extended labour force.
Labour market slack decreased the most in Lithuania, Greece and Spain
Overall, labour market slack decreased in all EU Member States in the second quarter of 2022 compared with the first quarter of 2022, except in five countries, where it increased: Slovenia (+0.5 p.p.), Belgium, Croatia and Austria (all +0.3 p.p.) and Portugal (+0.2 p.p.). It stood stable in three countries: Cyprus, Malta and Luxembourg. The highest decreases were found in Lithuania (-1.7 p.p.), Greece (-1.4 p.p.) and Spain (-1.3 p.p.).
For its part, employment rate rose in the majority of EU Member States (20 countries), decreased in Croatia and Belgium (both -0.5 p.p.), Luxembourg (-0.2 p.p.), as well as Cyprus and Portugal (both -0.1 p.p.). By contrast, the highest increases in employment were recorded in Lithuania (+1.6 p.p.), Latvia (+0.9 p.p.) as well as Ireland and Slovakia (both +0.8 p.p.), as displayed in Figure 2.
Focus on the gender gap in employment development
Looking at the development of the employment rate, the gender employment gap decreased by 0.2 p.p. between the first quarter of 2022 and the second quarter of 2022. The employment rate of women increased by 0.4 p.p. while the employment rate of men increased by 0.2 p.p. The biggest changes in gender gaps among EU Member States were found in Luxembourg (-2.6 p.p. due to an increase of 2.9 p.p. for women and a increase of 0.3 p.p. for men), Italy (+1.3 p.p. due to a decrease of -1.1 p.p. for women and an increase of 0.2 p.p. for men), Spain (+1.2 p.p. due to a decrease of -0.3 p.p. for women and an increase of 0.9 p.p. for men) and the Netherlands (+1.2 p.p. due to no change for women and an increase of 1.2 p.p. for men), as shown in Figure 3.
Unemployment in the EU Member States
Between the first quarter of 2022 and the second quarter of 2022 the unemployment rate fell in 17 Member States and stood at 5.8 % of the labour force in the EU, an overall decrease of 0.2 p.p. The unemployment rate remained unchanged in Germany (2.9 %), Italy (8.0 %) and Portugal (5.7 %) and increased in Czechia (from 2.3 % to 2.4 %), France (from 6.9 % to 7.0 %), Luxembourg (from 3.8 % to 4.0 %), Slovenia (from 4.0 % to 4.2. %), Belgium (from 5.2 % to 5.6 %), Cyprus (from 6.1 % to 6.5 %) and Croatia (from 6.2 % to 7.2. %). It decreased in all other countries, with the highest decreases observed in Lithuania (from 6.6 % to 5.4 %), Spain (from 12.9 % to 12.1 %), Greece (from 12.7 % to 12.0 %) and Ireland (from 4.4 % to 3.8 %) as shown in Figure 4.
Source: Eurostat
Legal Notice: The information in this article is intended for information purposes only. It is not intended for professional information purposes specific to a person or an institution. Every institution has different requirements because of its own circumstances even though they bear a resemblance to each other. Consequently, it is your interest to consult on an expert before taking a decision based on information stated in this article and putting into practice. Neither Karen Audit nor related person or institutions are not responsible for any damages or losses that might occur in consequence of the use of the information in this article by private or formal, real or legal person and institutions.


