March 27, 2023
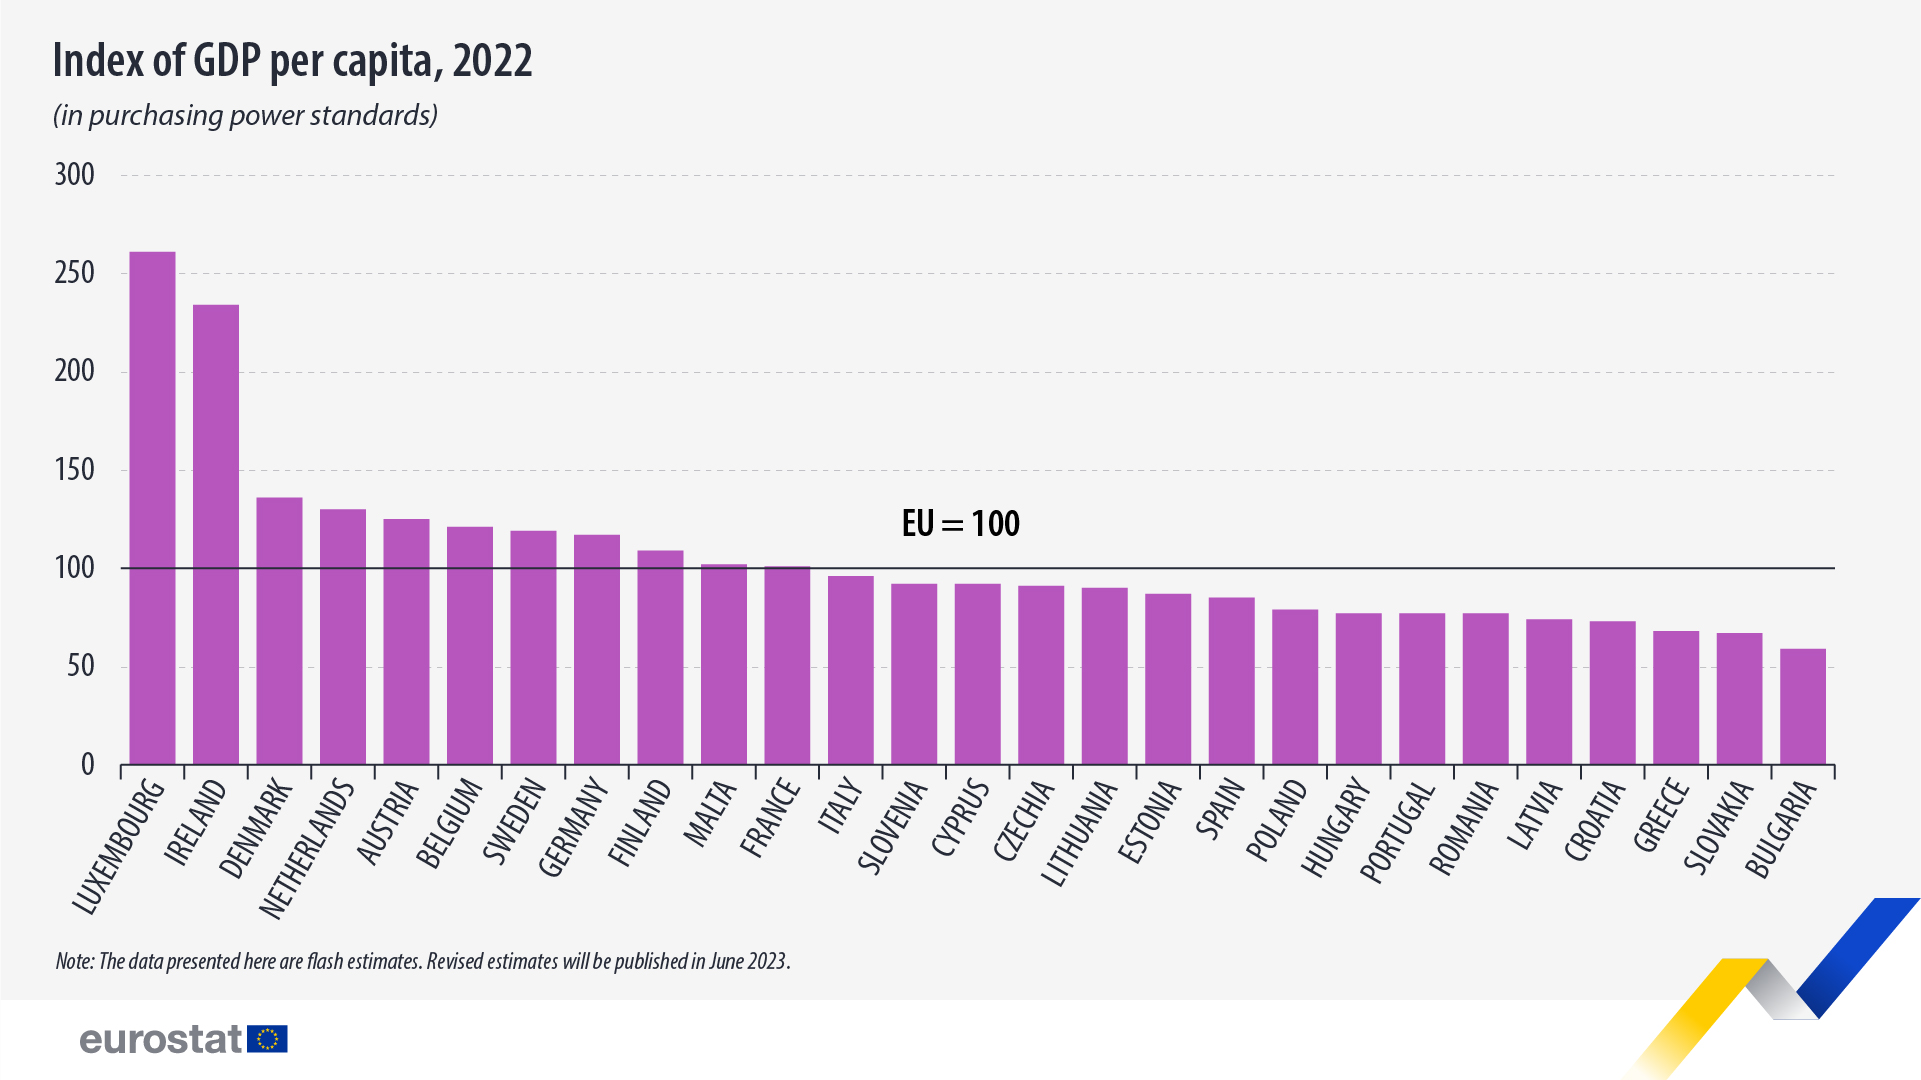
In 2022, gross domestic product (GDP) per capita expressed in purchasing power standards (PPS) ranged between 59% of the EU average in Bulgaria and 261% in Luxembourg.
This information comes from the flash estimates of purchasing power parities and GDP for 2022 published by Eurostat. The article presents some of the findings from the more detailed Statistics Explained article.
The data show substantial differences between the EU members in terms of GDP per capita, used to measure economic activity. In 2022, Luxembourg and Ireland recorded the highest levels of GDP per capita (161% and 134% above the EU average, respectively).
They were followed at a distance by Denmark (36% above the EU average), the Netherlands (30%), Austria (25%), Belgium (21%), Sweden (19%) and Germany (17%).
In contrast, Bulgaria (41% below the EU average), Slovakia (33%) and Greece (32%) registered the lowest GDP per capita.
Source: Eurostat
Legal Notice: The information in this article is intended for information purposes only. It is not intended for professional information purposes specific to a person or an institution. Every institution has different requirements because of its own circumstances even though they bear a resemblance to each other. Consequently, it is your interest to consult on an expert before taking a decision based on information stated in this article and putting into practice. Neither Karen Audit nor related person or institutions are not responsible for any damages or losses that might occur in consequence of the use of the information in this article by private or formal, real or legal person and institutions.


