November 18, 2022
Foreign trade relations in Azerbaijan
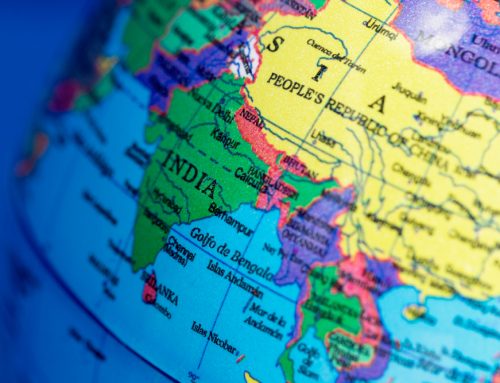
In January-August 2022 legal and natural entities of the Republic of Azerbaijan realized trade operations with their partners in 174 countries of the world, goods were exported to 119 countries and imported from 160 countries.
Taking into account value of statistically estimated exported crude oil and natural gas registered in the customs agencies but customs formalities of which not completed the foreign trade turnover of the country in January-August 2022 made 35608,3 million USD. 26739,9 million USD or 75,1% of trade turnover made the export value, 8868.4 (24,9%) million USD – import value and consequently positive trade balance reached to 17871.5 million USD. In comparison with January-August 2021, foreign trade turnover increased in actual prices by 70.4% and in real terms – by 6.6%. Export in real terms increased by 10.7% while import decreased by 1.0%.
In January-August 2022 the export of non-oil gas products, compared to the corresponding period of previous year, increased by 19.0% in actual prices and 7.0% in real terms and made 1885.5 million USD.
According to the State Customs Committee data, 37.1% of foreign trade turnover of the country was per the share of trade operations with Italy, 11.1% – Turkey, 6.3% – Russia, 4.4% – India, 3.8% – China, 3.4% – Israel, 2.7% – United Kingdom, 2.5% – Greece, 1.9% – Germany, 1.8% – Czech Republic, 1.7% – Croatia, 1.6% – Portugal, 1.5 – Georgia, per 1.4% – Ukraine and Spain, 1.2% – Tunisia, per 1.1% – Switzerland, USA and Kazakhstan, per 0.9% – Iran and Vietnam, and 11.1% – other countries.
48.9% of the total value of exported goods was per the share of Italy, 9.4% – Türkiye, 5.3 – India, 4.5% – Israel, 3.3% – Greece, 3.0% – United Kingdom, 2.3% – Croatia, 2.2% – Czech Republic, per 2.1% Portugal and Russia, per 1.7% – Georgia and Spain, 1.6% – Tunisia, per 1.3% – Switzerland and Ukraine, 1.0% – Germany, per 0.9% – Vietnam, Romania and Thailand, 5.6% – other countries.
The share of goods shipped to Russia (28.0%), Türkiye (26.0%), Georgia (6.7%), Switzerland (6.2%), USA (3.2%), Kazakhstan (2.3%), Italy (2.2%), Romania (2.2%), the Netherlands (2.1%), India (1.6%), Uzbekistan (1.5%), Bulgaria (1.3%), China (1.3%), Ukraine (1.2%), Belarus (1.2%), UK (1.2%), Brasilia (1.0%), Sweden (1.0%) was prevailed in export value on non– oil gas products.
Source: State Statistical Committee of the Republic of Azerbaijan
Legal Notice: The information in this article is intended for information purposes only. It is not intended for professional information purposes specific to a person or an institution. Every institution has different requirements because of its own circumstances even though they bear a resemblance to each other. Consequently, it is your interest to consult on an expert before taking a decision based on information stated in this article and putting into practice. Neither Karen Audit nor related person or institutions are not responsible for any damages or losses that might occur in consequence of the use of the information in this article by private or formal, real or legal person and institutions.


