
June 24, 2022
Before the war in Ukraine the reopening of the economy in 2021 was facing headwinds related to lingering supply-chain disruptions, and goods inflation had already picked up. The war that broke out in February 2022 has exacerbated inflation dynamics due to its effects on energy prices and has increased concerns about the outlook for economic activity. This is inevitably associated with stagflationary forces in the short term. Their occurrence has triggered a debate among economic commentators about whether a protracted period of stagflation is plausible. “Stagflation” has no unique definition but is associated with stagnating output and persistently high inflation occurring simultaneously. For the purposes of this box an expected stagflationary episode fulfils three conditions: (1) inflation expectations are high or increasing to levels that are inconsistent with the ECB’s price stability objective of two per cent, (2) the economy is expected to be in stagnation or recession, and (3) both conditions are expected to continue for at least a two-year period (in this case until the end of 2023). Stagflation expectations thus can be seen to relate to medium-term developments in real GDP growth and inflation, rather than the short-term dynamics of economic activity and inflation in the quarters immediately following the Russian invasion of Ukraine.
At present the euro area is facing a supply shock, similar to the 1970s oil supply shock, which has affected households’ expectations of economic growth and inflation. Faced with the additional adverse supply shock due to the war, consumers have markedly revised their expectations of the general economic outlook for the year ahead. This is evidenced in households’ opinions from the European Commission consumer survey between February and May 2022. The survey shows that consumers in the euro area have adjusted their expectations up for inflation and down for the economic situation (Chart A). How does this compare with national surveys from the well-known stagflation episode in the 1970s? That episode was triggered by the OPEC countries proclaiming an oil embargo in October 1973. Recent revisions to households’ expectations in some euro area countries are comparable to the revisions experienced in France and the United States shortly after the oil embargo. However, caution is warranted when assessing the quantitative implications of the impact of the shock across countries and over time, as household surveys only provide qualitative information.
Chart A
Revisions to consumers’ expectations of consumer prices and the economic situation
(revisions to expectations 12 months ahead; differences in percentage balances; x-axis: economic situation; y-axis: consumer prices)
Sources: European Commission’s Directorate-General for Economic and Financial Affairs, University of Michigan, Institut national de la statistique et des études économiques (INSEE), ECB calculations.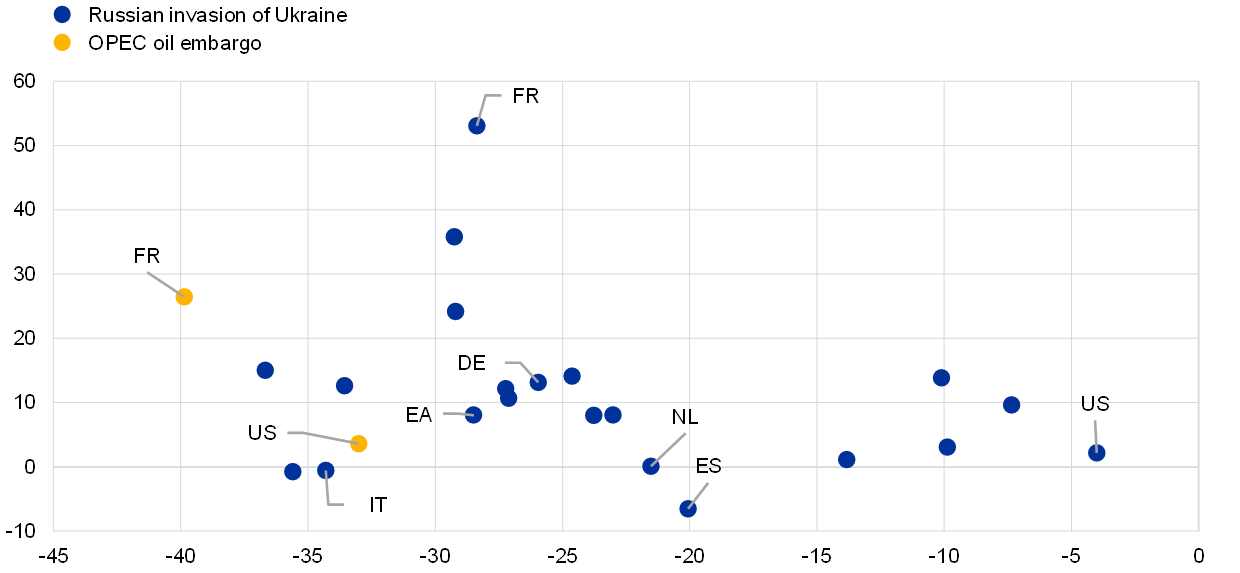
Notes: The revisions for the Russian invasion of Ukraine are from February to May 2022 (to April 2022 for the Unites States) and for the Organization of the Petroleum Exporting Countries (OPEC) oil embargo from October 1973 (from November 1973 for the United States) to February 1974. Only for France and the United States are survey data available from the 1970s.
In contrast to today, the early 1970s were characterised by persistently high price and cost inflation, amid declining growth and rising unemployment. Following the oil embargo in October 1973, most of the larger euro area countries and the United States saw a significant rise in inflation followed by a fall in real output (Chart B). In Germany, the path of inflation was more muted as the Deutsche Bundesbank introduced a quantitative money growth target to help control inflation after the collapse of the Bretton Woods system. In contrast to expectations in the current period, the supply-side shock in the 1970s also triggered rising unemployment and unit labour cost growth in some of the largest euro area countries, although in Germany and the United States unit labour cost growth remained more contained (Chart C).
Chart B
Inflation and real GDP growth in 1973 and now
(year-on-year percentage change, by quarter; x-axis: GDP growth; y-axis: inflation)
Sources: Deutsche Bundesbank, Institut national de la statistique et des études économiques (INSEE), Istituto Nazionale di Statistica (ISTAT), US Bureau of Labor Statistics, Organisation for Economic Co-operation and Development, ECB, ECB projection database and ECB staff calculations.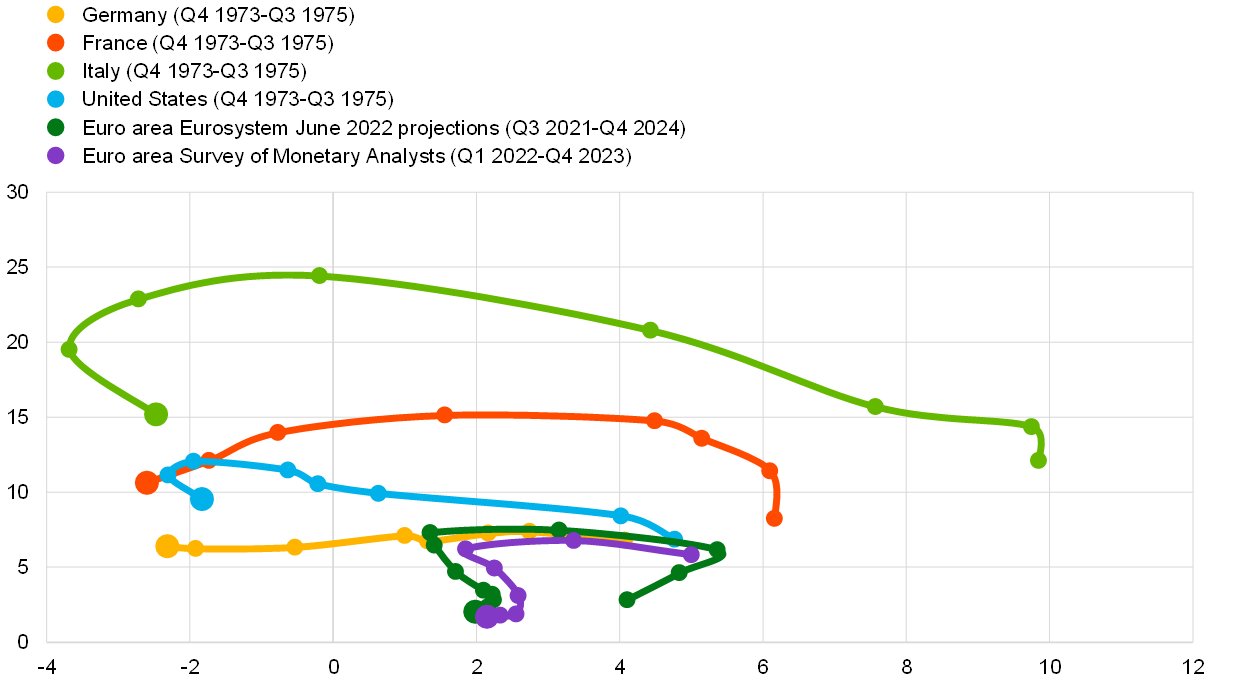
Note: The last observation for each region is shown with a larger marker to distinguish it from the preceding ones.
Chart C
Unemployment and unit labour costs after the oil price shock in 1973 and now
(x-axis: unemployment as a percentage of labour force; y-axis: unit labour cost; year-on-year percentage change, by quarter)
Sources: Haver, March 2022 ECB staff projections, ECB calculations.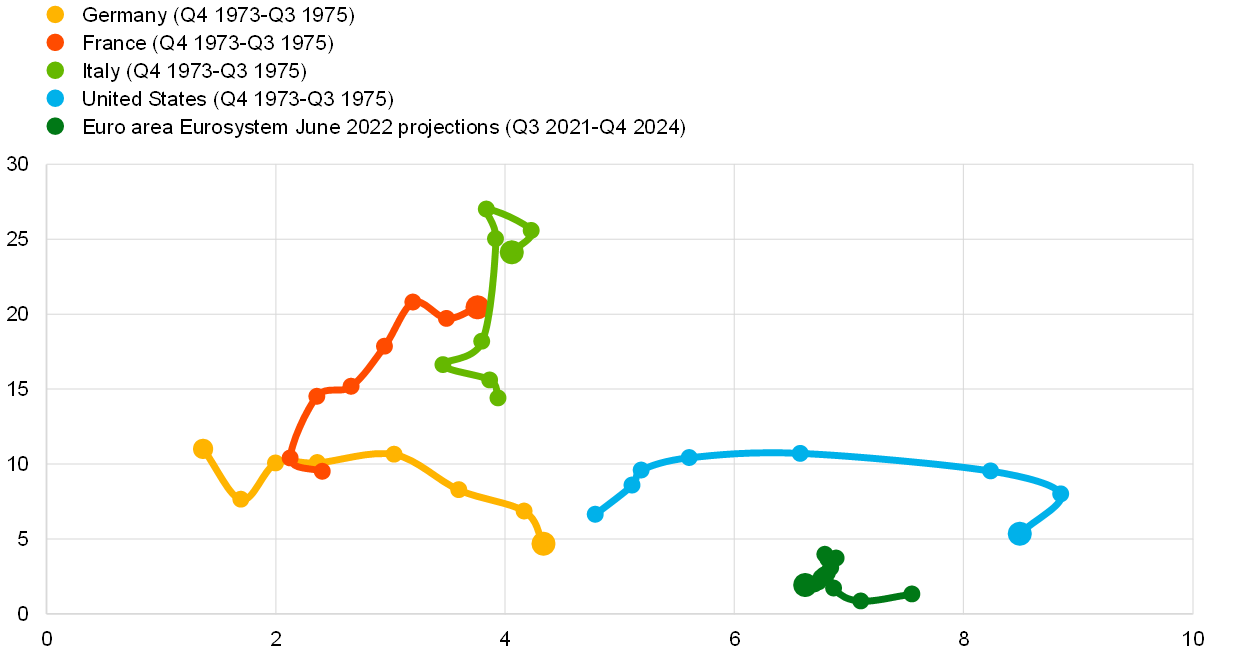
Note: The last observation for each region is shown with a larger marker to distinguish it from the preceding ones.
Current expert forecasts remain far from a stagflation scenario. This is despite the fact that the most recent surveys of professional forecasters from April and May 2022, e.g. Consensus Economics, the Eurozone Barometer, the ECB Survey of Monetary Analysts and the ECB Survey of Professional Forecasters, feature higher forecasts for inflation and lower real growth forecasts for both 2022 and 2023 compared with earlier this year. The forecast revisions are sharper for 2022 than for 2023 (Chart D). For 2023, nevertheless, the Consensus Economics real GDP growth forecast remains above 2% and only three forecasters expect growth below 1%. While inflation forecasts since the outbreak of the war are for inflation to be above 2% on average in 2023, most forecasters expect inflation to drop below 2% in the second half of 2023. However, uncertainty has increased, and the dispersion of forecasts has risen. The coefficients of variation for both inflation and growth forecasts have increased by more than 30% and 50% respectively since the start of the war.
Chart D
Inflation and GDP growth expectations of private sector forecasters for 2022 and 2023
(annual percentage change)
Source: Consensus Economics.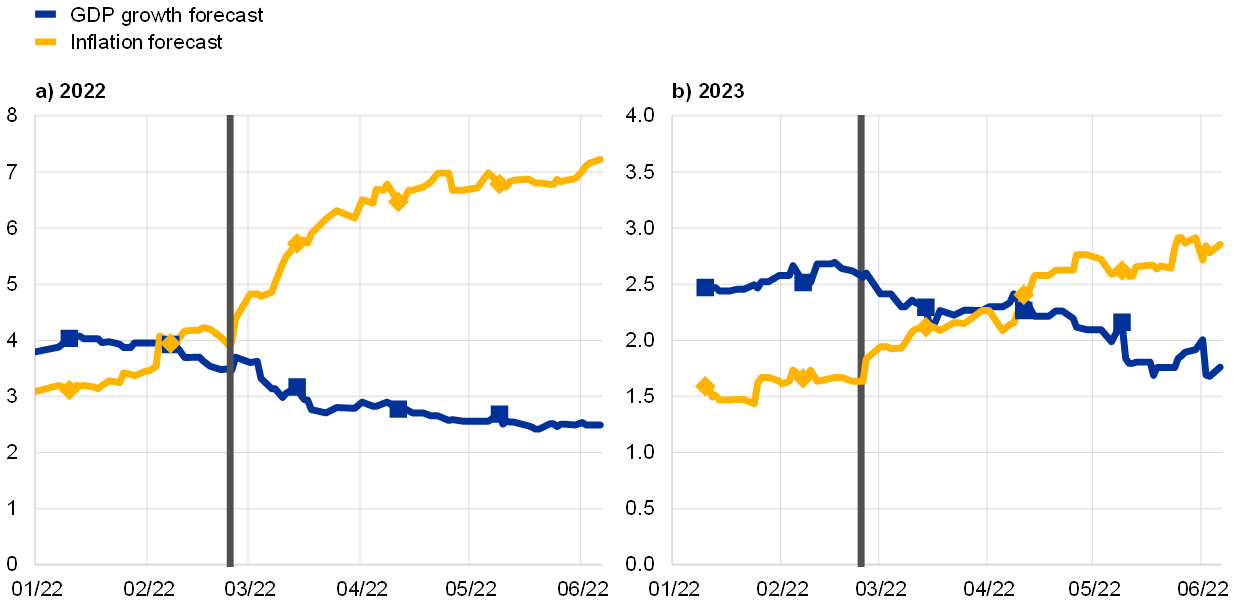
Notes: The lines represent Replacement Basis Continuous Consensus Forecasts which are calculated each business day between monthly survey dates on a Replacement Basis (prior monthly survey panel with subsequent new or revised forecasts replacing old). The squares and diamonds indicate the average Consensus Forecast in the regular monthly Consensus Economics surveys. The vertical line in each chart refers to the date of the Russian invasion of Ukraine on 24 February 2022.The latest observation is for 6 June 2022.
Several differences between the current economic situation and that in the 1970s make it less likely that stagflation will develop now. First, oil dependence has decreased substantially, reducing the potential economic impact of oil price shocks. At the same time, gas dependence has increased substantially so external shocks to gas prices now play a more prominent role. Second, the risk of large second-round effects on inflation has diminished despite the very tight labour market, as formal wage indexation schemes are less common and workers have become less unionised. Third, current real GDP growth projections still partly reflect a recovery in demand following the pandemic. This is being driven not only by the easing of restrictions and the reopening of the economy but also by policy support (e.g. the Next Generation EU and national implementation plans). Finally, compared with the strategies implemented by the various national monetary authorities in the 1970s, today’s euro area monetary policy strategy is more clearly aimed at anchoring inflation expectations and bringing inflation to 2% over the medium term.
Source: European Central Bank
Legal Notice: The information in this article is intended for information purposes only. It is not intended for professional information purposes specific to a person or an institution. Every institution has different requirements because of its own circumstances even though they bear a resemblance to each other. Consequently, it is your interest to consult on an expert before taking a decision based on information stated in this article and putting into practice. Neither Karen Audit nor related person or institutions are not responsible for any damages or losses that might occur in consequence of the use of the information in this article by private or formal, real or legal person and institutions.


