Monthly Survey of Manufacturing, May 2024
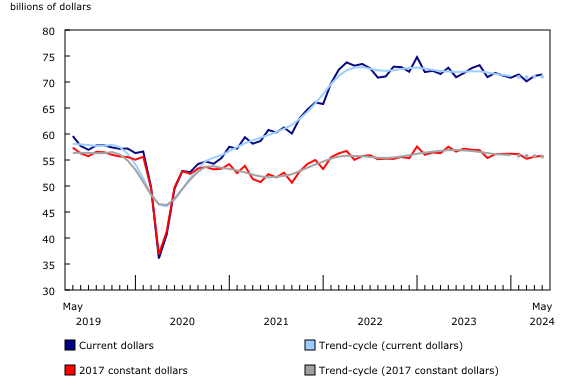
Sales in constant dollars rose 0.4% in May, while the Industrial Product Price Index was unchanged and the Raw Materials Price Index declined 1.0%.
Aerospace product and parts industry group posts the largest increase
Following a 6.1% decrease in April, production of aerospace products and parts rose 11.2% to $2.7 billion in May, the highest level on record. The post-COVID-19 pandemic surge in commercial and business aircraft markets mainly drove demand for aviation industry products in 2023 and remained strong in 2024. Year over year, production in this industry group rose 23.9% in May.
Sales of food products increased 1.4% to $13.0 billion in May, the third-highest level on record. The gain was widespread across all food industry groups, led by seafood (+36.2%), meat (+5.7%), and bakeries and tortilla (+8.9%) manufacturing. Seasonal demand contributed to the increase as sales of food in constant dollars rose 1.1% in May.
Following a 5.3% increase in April, sales of motor vehicles fell 4.2% to $4.6 billion in May. A new retooling in an auto assembly plant in Ontario was mainly responsible for the decline. More generally, retooling to electric vehicle production also impacted sales of motor vehicle parts, which declined 1.6% to $3.0 billion in May. Despite lower sales of motor vehicles and parts in May, their exports rose 3.8%, mainly on higher exports of light trucks to the United States. Total sales of motor vehicles on a yearly basis fell 12.5% in May.
Sales increase in six provinces
Manufacturing sales increased in six provinces in May, led by Quebec (+1.2%) and Ontario (+0.5%), while Saskatchewan posted the largest decline (-13.1%).
In Quebec, sales rose 1.2% to $18.6 billion in May, the fourth consecutive monthly increase. The gain was mainly driven by higher production of aerospace products and parts (+11.7%) as well as sales of non-ferrous metals (+10.2%). Sales in the non-ferrous metal (except aluminum) production and processing industry group in May reached their highest level on record due to higher demand and prices. These two industry groups also largely contributed to the higher sales in Montréal (+1.7%) in May. Year over year, total sales in Quebec rose 6.0% in May.
Sales in Ontario increased 0.5% to $31.3 billion in May, mainly on higher sales of food (+3.7%) and plastics and rubber (+5.7%) products. A decline in sales of pharmaceutical and medicine products partly offset the increase. In Toronto, sales were down 3.5% to $12.2 billion in May, mainly attributable to lower sales of chemicals (-17.7%) and motor vehicles (-15.8%).
In Saskatchewan, sales fell 13.1% to $1.8 billion in May, primarily driven by a 15.5% decline in sales of non-durable goods. With the monthly decrease in May, total sales in Saskatchewan were 15.5% lower compared with the same month a year earlier.
Total inventories edge up
Total inventory levels edged up 0.2% to $121.2 billion in May on higher inventories in 10 of 21 subsectors. Higher goods in process (+1.3%) was responsible for the increase, while finished products declined 0.3% and raw materials were unchanged. Higher inventories of transportation equipment (+2.2%), computers and electronics (+5.4%) and wood products (+2.2%) were partially offset by declines in inventories of chemical products (-2.1%) and primary metals (-1.4%). On a year-over-year basis, total inventories were down 1.4% in May.
The inventory-to-sales ratio held steady in May, remaining at 1.70. This ratio measures the time, in months, that would be required to exhaust inventories if sales were to remain at their current level.
Unfilled orders increase
Total unfilled orders were up 0.8% to $105.5 billion in May, the second consecutive monthly increase. Higher unfilled orders of other transportation equipment (+16.6%) and machinery (+2.9%) mainly drove the increase.
Capacity utilization rate increases
The capacity utilization rate (not seasonally adjusted) for the total manufacturing sector rose from 78.4% in April to 80.4% in May due to higher production. The gain was noticeable in the chemical (+8.2 percentage points), petroleum and coal product (+7.0 percentage points), and plastics and rubber (+5.3 percentage points) subsectors. The capacity utilization rate in the transportation equipment subsector declined 2.6 percentage points in May.
Source: Statistics Canada
Legal Notice: The information in this article is intended for information purposes only. It is not intended for professional information purposes specific to a person or an institution. Every institution has different requirements because of its own circumstances even though they bear a resemblance to each other. Consequently, it is your interest to consult on an expert before taking a decision based on information stated in this article and putting into practice. Neither Karen Audit nor related person or institutions are not responsible for any damages or losses that might occur in consequence of the use of the information in this article by private or formal, real or legal person and institutions.


