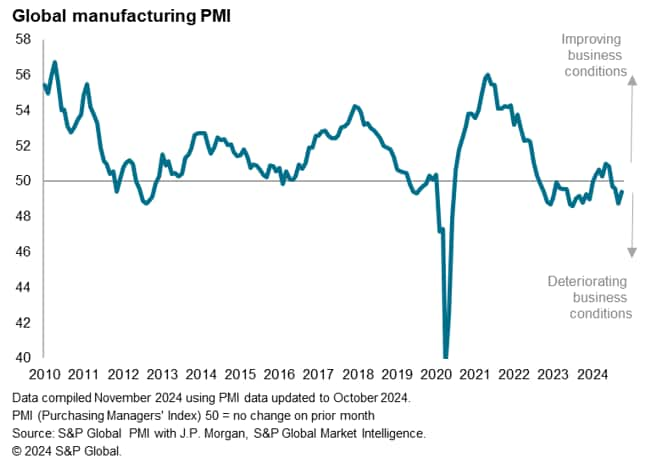
The global manufacturing downturn persisted into October, but the rate of decline moderated. At 49.4, up from 48.7 in September, the Global Manufacturing PMI, sponsored by J.P. Morgan and compiled by S&P Global Market Intelligence, remained below the 50.0 no change level to signal a deterioration of operating conditions for a fourth successive month in October. The rise in the index indicated a moderation in the rate of decline from the 14-month high seen in September, albeit merely to the weakest since August.
October’s PMI rise in part reflected manufacturing conditions returning to growth in mainland China while downturns eased in both the US and eurozone.
Here are our top five takeaways from October’s manufacturing PMI surveys, which provide a deeper insight into the current manufacturing trends relating to output, demand, inventories, supply chains, employment and prices.
1. Global output steadies after September’s fall, but with marked regional variations
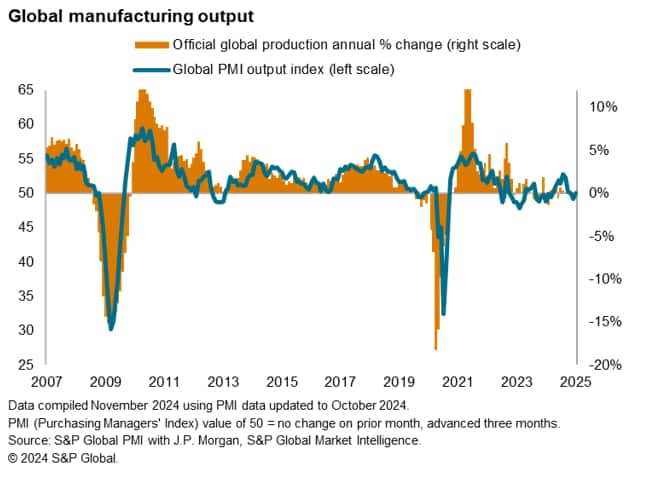
The PMI survey’s sub-index of production, which tracks actual month-on-month changes in factory output, signaled a marginal rise in production volumes in October, providing welcome news of stabilization after output fell for the first time in nine months in September.
The survey data exhibit a correlation of 75% with the official annual rate of change in global production, with the survey data acting with a three-month lead. Using a simple regression-based model, the latest PMI data indicate that worldwide manufacturing output has remained stalled in October after a flat picture over the third quarter as a whole.
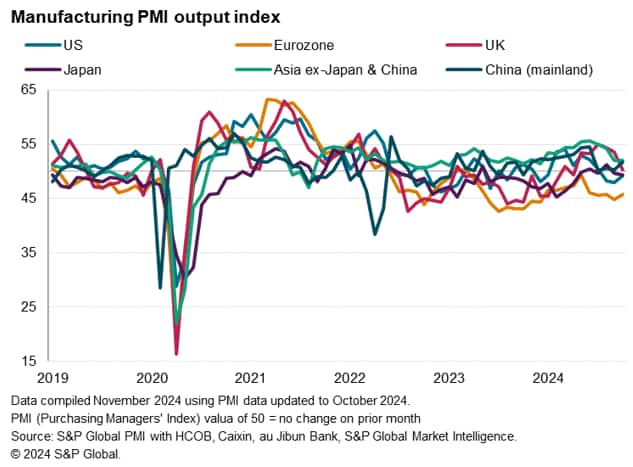
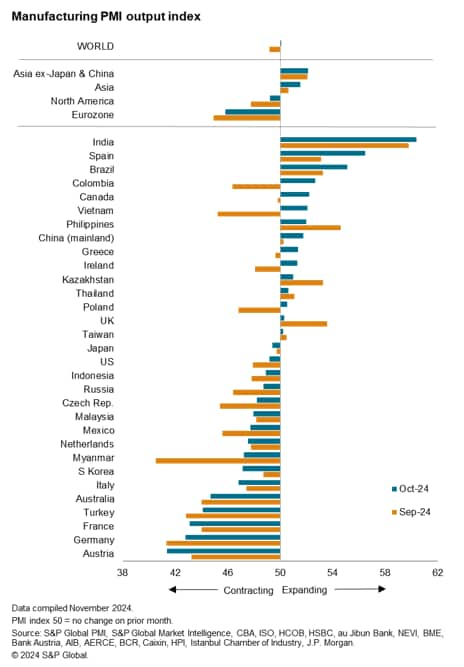
However, the flat picture masks marked variations in production trends around the world. Among the major economies, the eurozone continued to report the steepest fall in production, led by Austria, Germany and France, albeit with the rate of decline cooling to the joint-slowest since June. Output also fell especially sharply in Australia and South Korea. The latter’s rate of decline hit a 16-month high.
Further production declines, albeit only modest, were seen in the US and Japan, with Mexico and Russia also reporting falling volumes. Of note, the US production decline was only slight and the smallest seen over the latest three-month period of contraction
In contrast, especially strong growth continued to be reported in India, with Spain and Brazil also reporting robust gains. However, Vietnam reported the largest acceleration of output growth during the month, and an especially notable improvement was seen in mainland China, where growth accelerated to the fastest since June.
While the UK saw sustained growth, the latest rise was only very modest reflecting the largest loss of growth momentum of all economies surveyed in October.
In total, output rose in 15 of the 31 individual economies for which PMI data are available but fell in the remaining 16.
2. Global goods trade remains firmly in decline as firms cut inventories
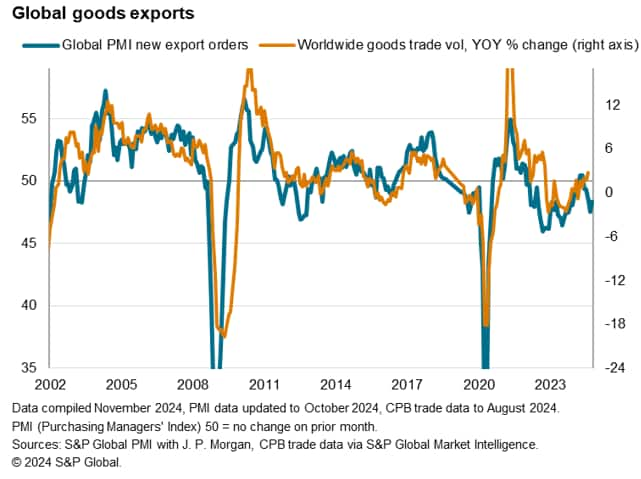
Global trade flows again acted as a particular drag on production, with new export orders reportedly falling globally for a fifth successive month in October. Global goods exports have now fallen almost continually since early 2022 amid the post-pandemic shift in demand from goods to services and a sustained trend toward inventory reduction. The amount of inputs purchased by manufacturers has likewise fallen almost continually since mid-2022, declining again in October.
The PMI data point to global trade volumes falling 3-4% in year-on-year terms, albeit with the rate of decline moderating slightly in October.
3. Optimism and employment hit by uncertainty
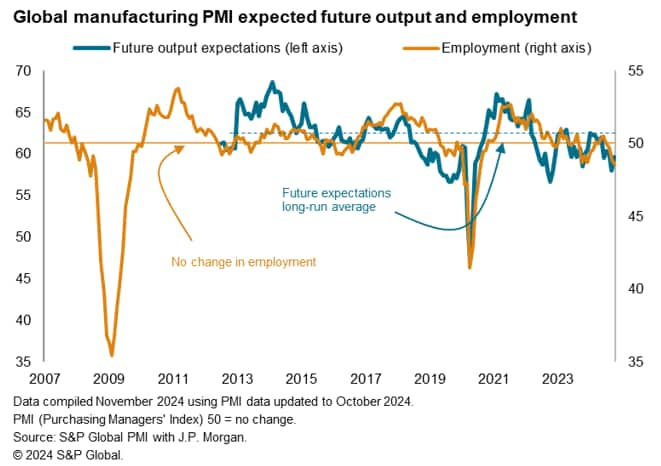
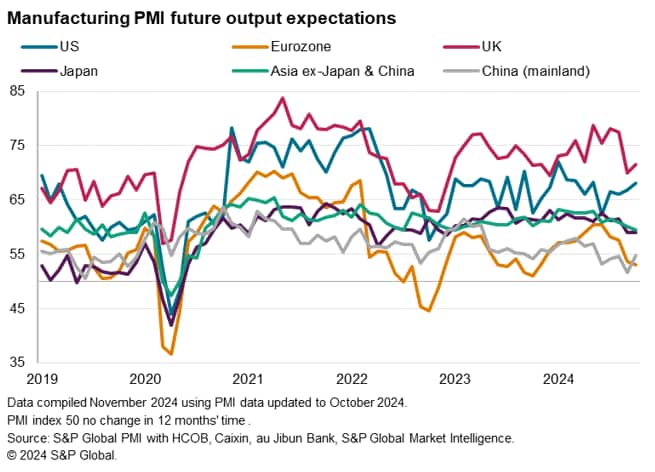
Optimism about the outlook over the next 12 months remained firmly below the long-run average in October, signaling below-normal business expectations about factory output levels in the year ahead worldwide.
Low output expectations were often attributed to geopolitical concerns, including uncertainty over the outcome of the US elections, especially in relation to tariffs and protectionism, as well as instability caused by various conflicts.
However, the overall degree of optimism rose compared to September, largely reflecting two developments. First, producers in mainland China reported improved prospects on the back of recent government stimulus measures. Second, US producers reported brighter sentiment amid hopes of greater stability and better trading conditions after the US election.
4. Producer input price inflation steadies despite rising supply delays
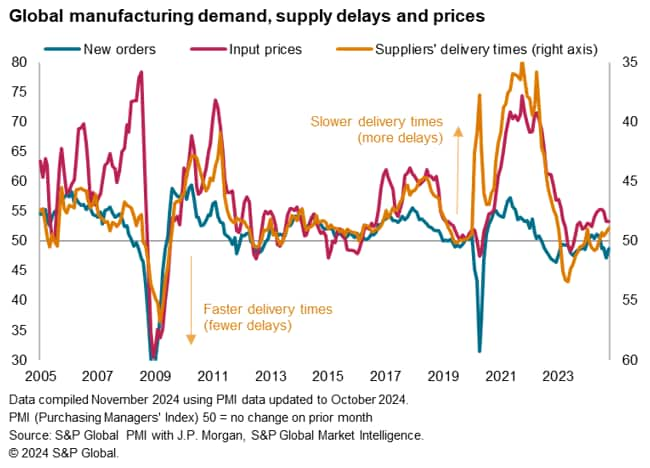
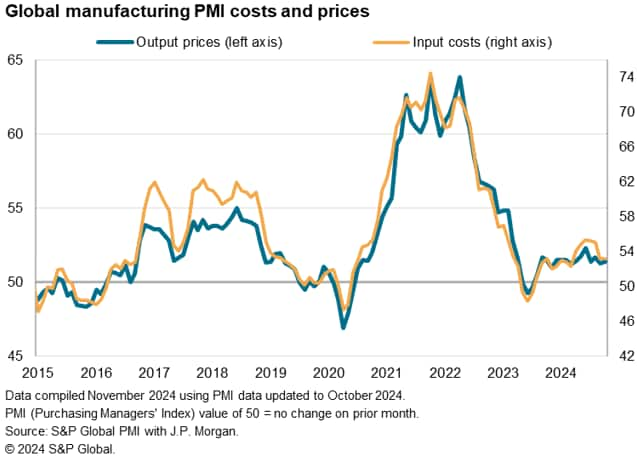
Global producer input price inflation held steady on September’s six-month low, continuing to run well below the average seen in the decade prior to the pandemic. As such the data point to subdued raw material cost pressures by historical standards.
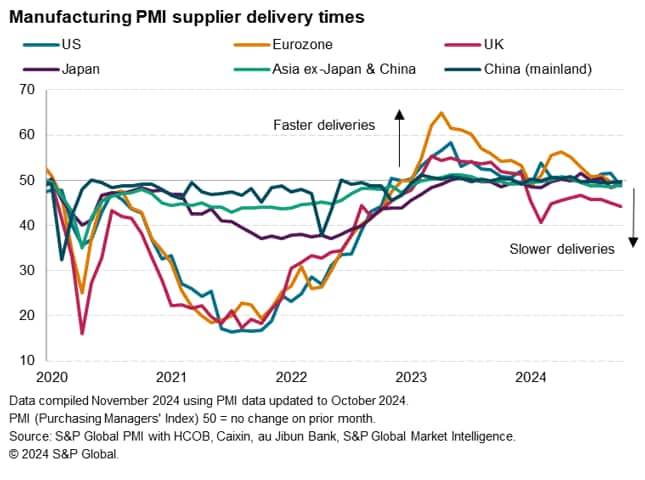
The modest rate of input cost inflation comes despite a lengthening of suppliers’ delivery times, with the survey indicating the highest incidence of delays in 22 months during October. Longer delivery times are usually associated with higher prices. However, weak demand continued to restrain supplier pricing power, as reflected by a fall in new orders in the goods producing sector for a fourth straight month in October.
Supplier delivery performance varied globally, with the UK again reporting a higher degree of supply delays amid shipping related issues than other major economies. Supply delays were also notably reported in the US due to hurricane related disruptions, causing US supply chains to lengthen to the greatest extent for nine months, albeit only modestly.
5. Manufacturing selling price inflation muted by weak demand
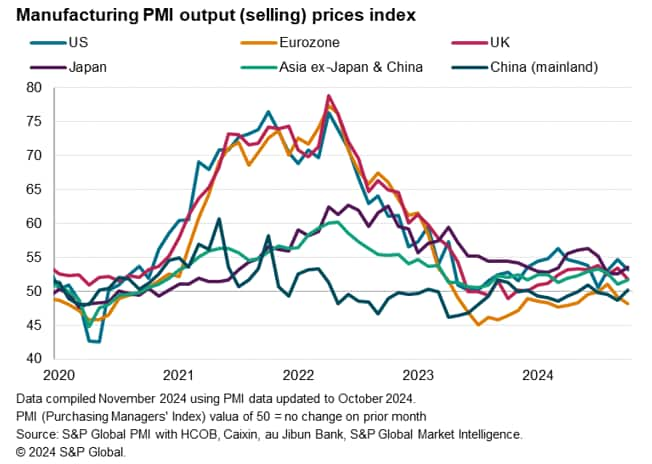
Subdued input cost growth fed through to muted selling price inflation in October. Measured globally, average prices charged by manufacturers for their goods rose only modestly in October, the rate of inflation edging marginally higher but running at a rate equaling the average seen in the decade prior to the pandemic.
Looking at the major economies, prices fell in the eurozone and were largely unchanged in mainland China. Rates of increase meanwhile cooled in the US and UK, but edged higher in Japan and India.
Source: S&P GLOBAL – by hris Williamson
Legal Notice: The information in this article is intended for information purposes only. It is not intended for professional information purposes specific to a person or an institution. Every institution has different requirements because of its own circumstances even though they bear a resemblance to each other. Consequently, it is your interest to consult on an expert before taking a decision based on information stated in this article and putting into practice. Neither Karen Audit nor related person or institutions are not responsible for any damages or losses that might occur in consequence of the use of the information in this article by private or formal, real or legal person and institutions.


