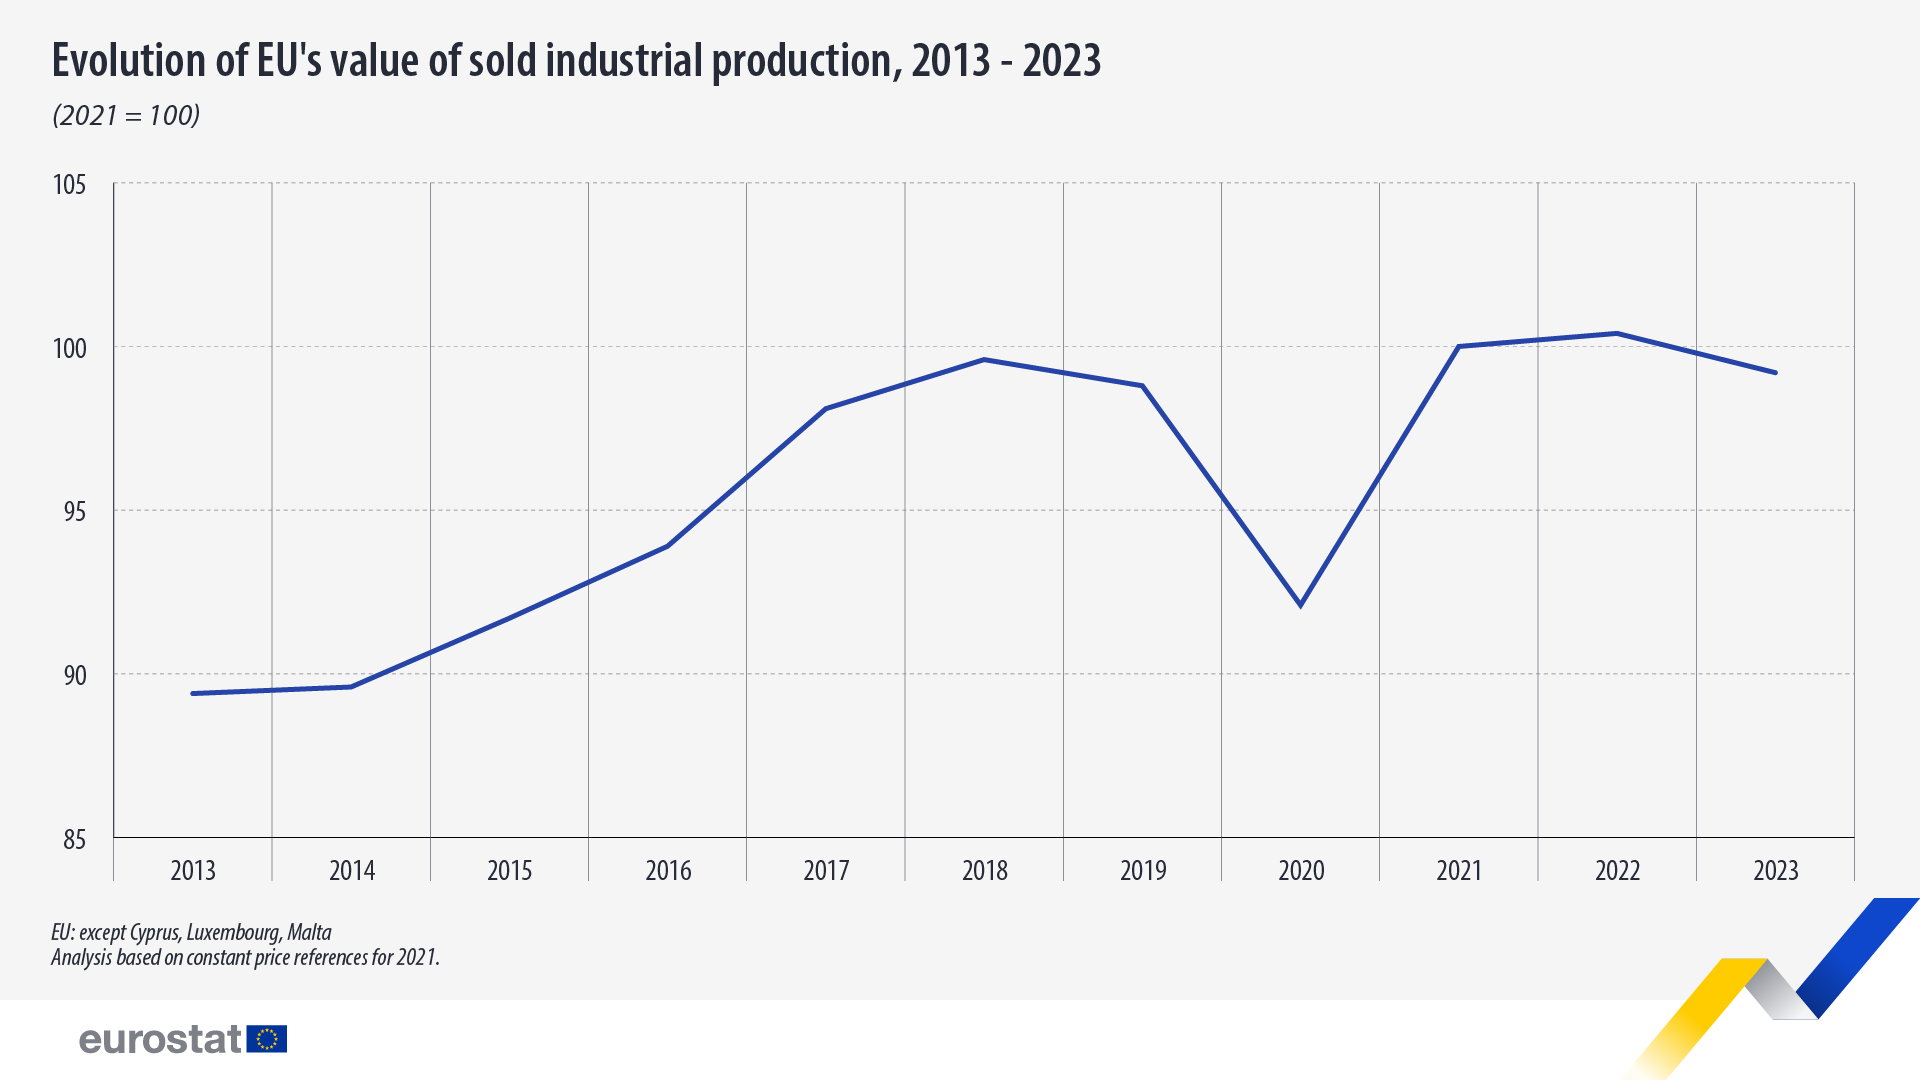
After 2 successive increases, +8.5% in 2021 compared with 2020 and +0.4% in 2022 compared with 2021, the EU’s production of manufactured goods registered a decrease of 1.2% in 2023 compared with 2022.
After a slight decrease in 2013 and 2014, the EU’s production increased gradually until 2018. In 2019, the value of sold production registered a small decrease, then dropped more sharply in 2020 due to the pandemic’s effects. The outbreak of COVID-19 and related containment measures widely introduced by EU countries had a significant impact on the EU’s industrial production in 2020, but 2021 and 2022 showed increases in production in all the industrial activity groups.
In nominal terms, the EU’s value of sold production went up from €5 895 billion in 2022 to €5 992 billion in 2023, indicating a 1.6% increase.
This information comes from data on the production of manufactured goods published by Eurostat. The article presents a handful of findings from the more detailed Statistics Explained article on industrial production, which also includes analysis by country and sector.
Value of sold manufacturing of motor vehicles & other transport equipment up by 20%
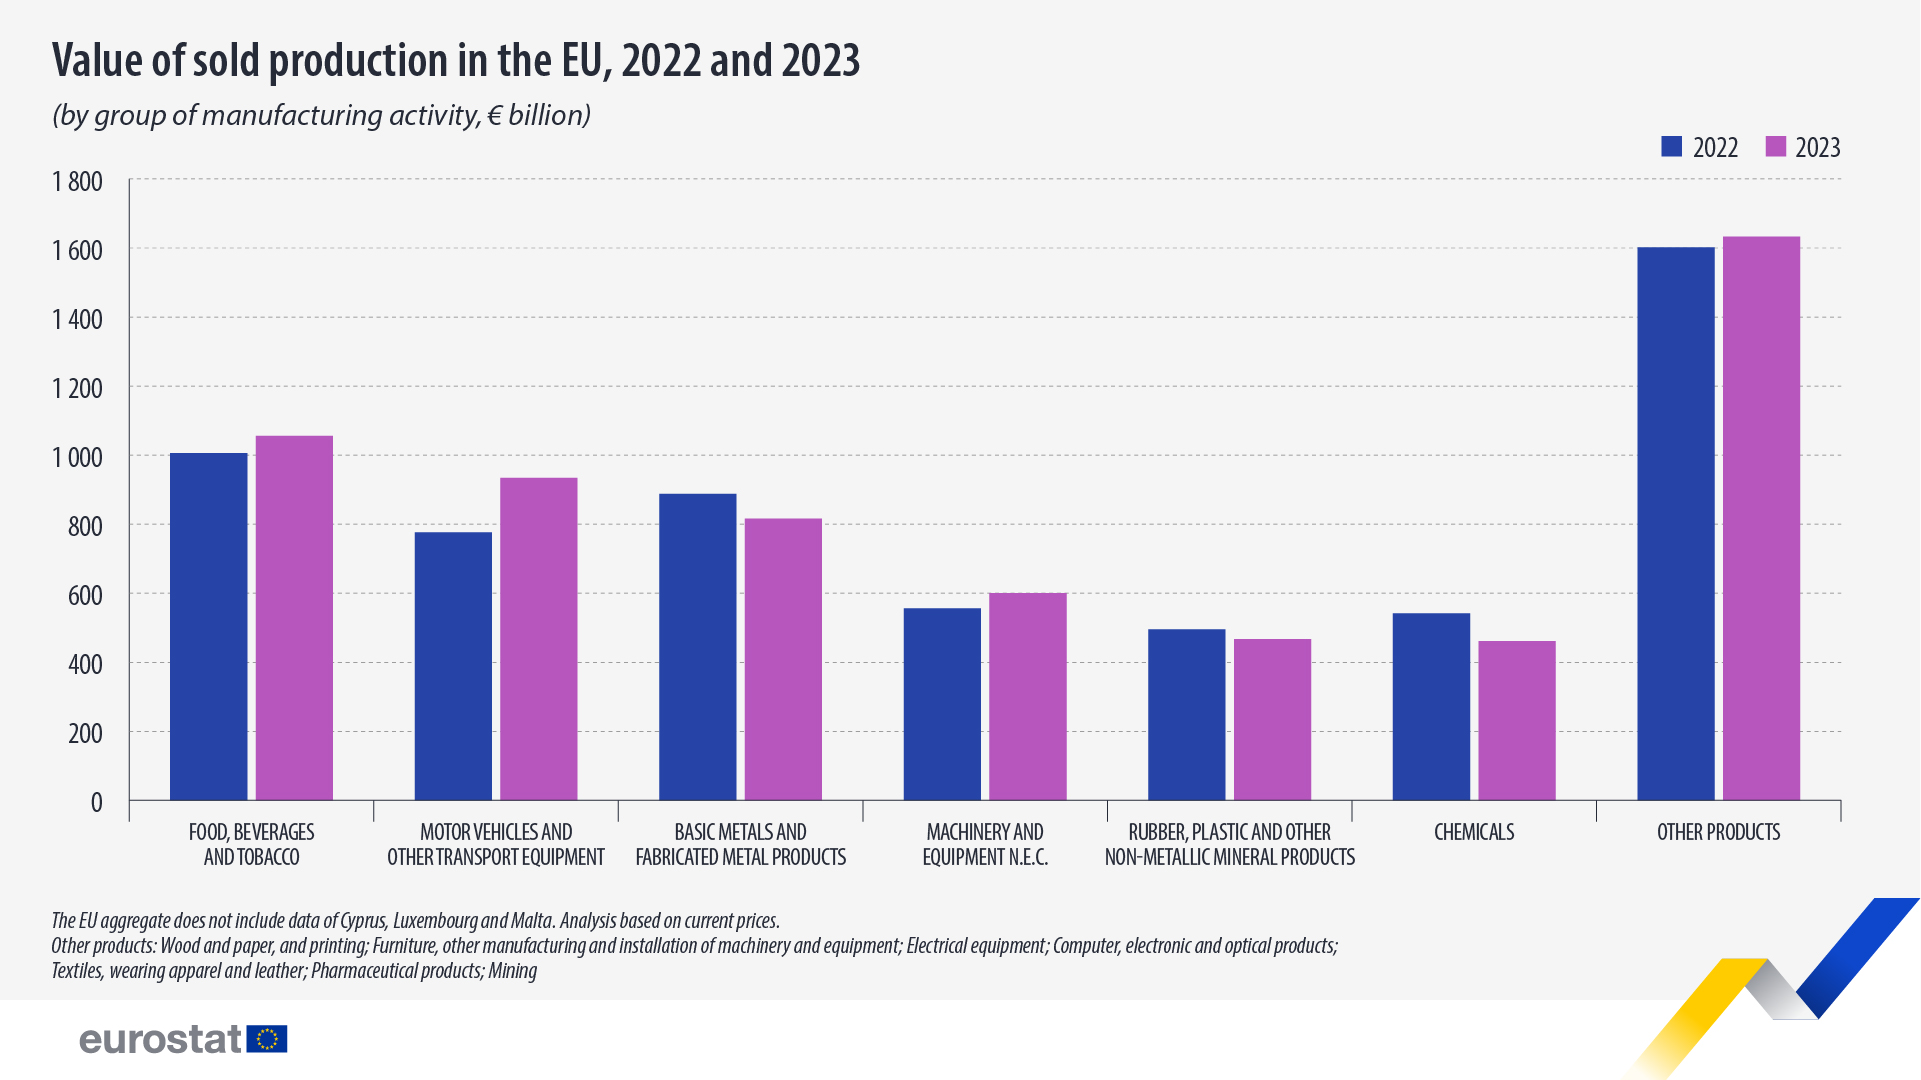
Looking at the top 7 groups of manufacturing activities, the highest jump in sold production value was recorded in the manufacturing of motor vehicles and other transport equipment, with a 20% increase in production value (at current prices) from €776 billion in 2022 to €934 billion in 2023. This group was followed by the manufacturing of machinery and equipment (€556 billion in 2022 to €600 billion in 2023), with an 8% increase in sold production value, and by the manufacturing of food, beverages and tobacco (€ 1 006 billion to € 1 056 billion), with a 5% growth.
On the other hand, the highest decrease in sold production value was recorded in the manufacturing of chemicals (€542 billion to €461 billion), with a 15% drop, followed by the manufacturing of basic metals and fabricated metal products (€888 billion to €816 billion) with 8% and the manufacturing of rubber, plastic and other non-metallic mineral products (€495 billion to €467 billion) with 6%.
Source: Eurostat
Legal Notice: The information in this article is intended for information purposes only. It is not intended for professional information purposes specific to a person or an institution. Every institution has different requirements because of its own circumstances even though they bear a resemblance to each other. Consequently, it is your interest to consult on an expert before taking a decision based on information stated in this article and putting into practice. Neither Karen Audit nor related person or institutions are not responsible for any damages or losses that might occur in consequence of the use of the information in this article by private or formal, real or legal person and institutions.


