October 6, 2023
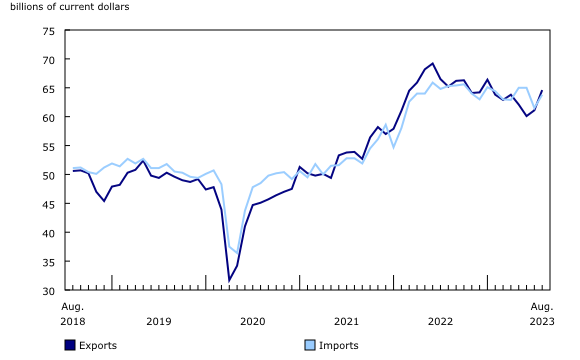
In August, Canada’s merchandise exports increased 5.7%, while imports rose 3.8%. These strong monthly gains followed disruptions in port operations in British Columbia, which affected merchandise trade activity in July.
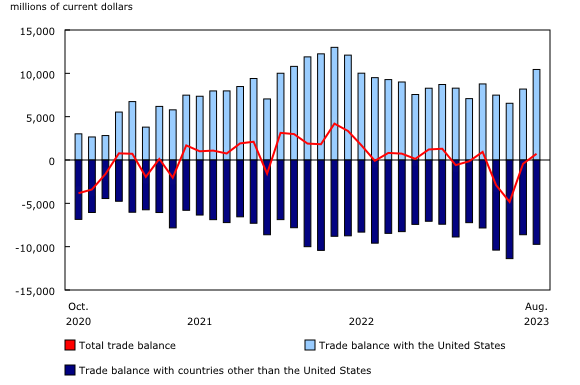
Canada’s merchandise trade balance went from a deficit of $437 million in July to a surplus of $718 million in August, the first trade surplus observed since April. These trade balances are close to the typical bounds for monthly revisions to imports and exports.
The contribution of prices to the monthly movements was noteworthy in the results for merchandise exports and imports. In real (or volume) terms, exports rose 3.0% in August compared with July, while imports in real terms increased 1.2%.
Higher exports of gold and crude oil
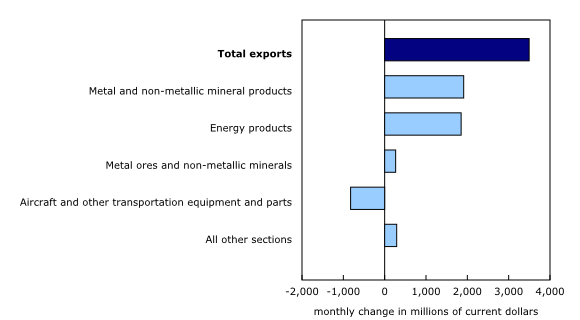
Total exports rose 5.7% in August, the strongest percentage increase since October 2021. Overall, exports were up in 7 of the 11 product sections, with exports of unwrought gold and crude oil contributing the most to the monthly gain. Excluding gold and crude oil, exports were essentially unchanged in August.
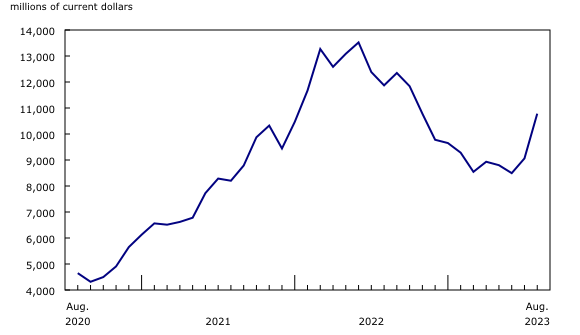
Exports of metal and non-metallic mineral products increased 29.1% in August to a record $8.5 billion. This gain follows three consecutive months of large declines. Exports of unwrought gold, silver, and platinum group metals (+89.5%) were the largest contributor to the August increase, due in part to higher exports of gold to the United States. An increase in gold asset transfers in the banking sector contributed the most to the monthly movement.
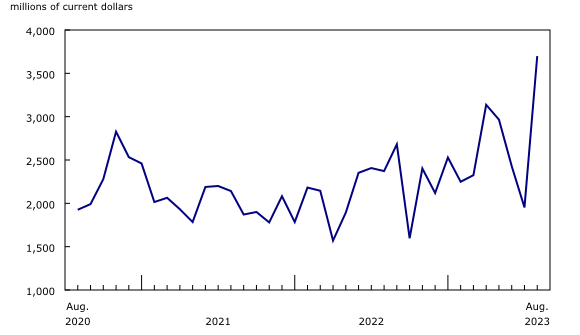
The value of energy product exports increased 14.6% in August, driven mostly by prices, which posted their strongest growth since March 2022. After falling 37.2% from the record high observed in June 2022 to the low observed in June 2023, the value of crude oil exports (+19.0% in August) rose for a second consecutive month in August and was the largest contributor to the increase in this product section. Market prices for crude oil rose recently, partly because of the anticipation that certain countries from the Organization of the Petroleum Exporting Countries and its partners (OPEC+) would continue their voluntary restrictions on crude production.
Amid the resumption of port activities in British Columbia, increases were observed in subcategories of products largely exported from this province, such as coal (+14.2%), potash (+21.4%) and lumber (+5.8%).
Widespread increase in imports
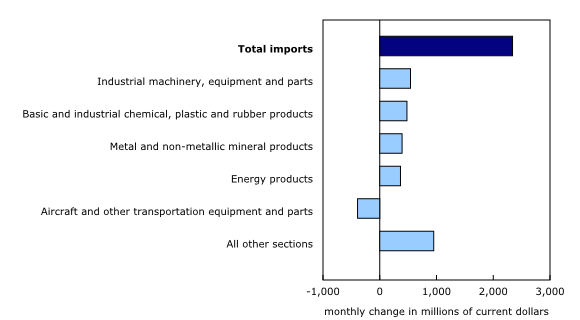
After posting the sharpest decline in 18 months in July (-5.4%), total imports increased 3.8% in August, offsetting two-thirds of the previous month’s decrease. Overall, increases were observed in 9 of the 11 product sections.
After falling 5.5% in July, imports of industrial machinery, equipment and parts rose 7.5% in August, with seven of the eight product subcategories increasing. Imports of other general-purpose machinery and equipment (+10.6%) posted the strongest growth. Heavy machinery for the steel and automotive manufacturing industries was imported from the United States, Italy, and Thailand in August. Also contributing to the increase in imports of industrial machinery, equipment and parts were imports of agricultural, lawn and garden machinery and equipment, which rose 40.7% in August, after dropping 29.2% in July.
Following four consecutive monthly declines, imports of chemical products were up 11.2% in August. The largest increase was observed in imports of basic chemical products (+15.7%), largely due to high-value imports of active pharmaceutical ingredients from Switzerland. Imports of fertilizers, pesticides and other chemical products (+16.1%) also contributed to the gain. While fertilizer imports generally begin to rise in September, they posted an atypical increase in August. Fertilizer market prices have fallen sharply in recent months, potentially driving importers to buy earlier than usual.
Other product sections also benefitted from the resumption of port operations in British Columbia in August and offset part of the losses recorded in July, including imports of consumer goods (+2.2%) and electronic and electrical equipment and parts (+3.7%).
Trade with countries other than the United States rises
Exports to countries other than the United States were up 7.7% in August. Exports to Japan (various products), the United Kingdom (gold and crude oil) and the Netherlands (various products) saw the sharpest increases. After falling 12.6% in July, imports from countries other than the United States rose 9.8% in August. Imports from China (widespread increases throughout imported products) and South Korea (various products) saw the largest gains. Canada’s trade deficit with countries other than the United States widened from $8.6 billion in July to $9.7 billion in August.
Trade surplus with the United States widens
Exports to the United States increased 5.2% in August, boosted by strong energy product prices. Meanwhile, imports from the United States rose 0.6%. As a result, Canada’s trade surplus with the United States widened from $8.2 billion in July to $10.4 billion in August, the highest surplus observed since June 2022, when Canadian exports to the United States were at a record high.
Revisions to July merchandise export and import data
Imports in July, originally reported at $61.4 billion in the previous release, were revised to $61.5 billion in the current reference month. Exports in July, originally reported at $60.4 billion in the previous release, were revised to $61.1 billion in the current reference month’s release.
Monthly trade in services
In August, monthly service exports decreased 0.7% to $15.0 billion. Meanwhile, service imports were up 0.7% to $16.4 billion.
When international trade in goods and services are combined, exports increased 4.5% to $79.5 billion in August, while imports rose 3.2% to $80.3 billion. As a result, Canada’s trade deficit with the world went from $1.7 billion in July to $743 million in August.
Source: Statistics Canada
Legal Notice: The information in this article is intended for information purposes only. It is not intended for professional information purposes specific to a person or an institution. Every institution has different requirements because of its own circumstances even though they bear a resemblance to each other. Consequently, it is your interest to consult on an expert before taking a decision based on information stated in this article and putting into practice. Neither Karen Audit nor related person or institutions are not responsible for any damages or losses that might occur in consequence of the use of the information in this article by private or formal, real or legal person and institutions.

