November 10, 2022
A large proportion of import and export transactions are completed in US dollars and must be converted to Canadian dollars to compile monthly trade statistics. When the Canadian dollar depreciates against the US dollar, converted monthly trade values in Canadian dollars are higher.
In September, the average value of the Canadian dollar decreased 2.3 US cents compared with the average value in August, falling to 75.1 US cents. This was the largest monthly decrease since March 2020. When expressed in US dollars, Canadian exports were down 1.7% in September, and imports decreased 2.5%. The Canadian dollar also depreciated in October, by 2.1 US cents, and this decline will also have an impact on the results published for the next reference month.
Exports of wheat rebound
Following decreases of 3.7% in July and 2.7% in August, total exports rose 1.3% in September to reach $66.4 billion. Increases were observed in 6 of the 11 product sections. In real (or volume) terms, total exports rose 1.7% in September, while export prices were down for a fourth consecutive month.
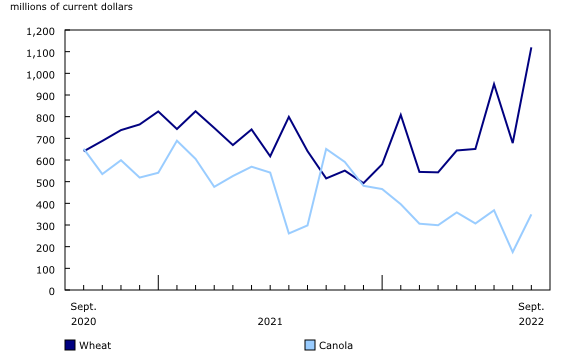
Exports of farm fishing and intermediate food products (+16.7%) contributed the most to the overall increase in exports in September. Exports of wheat, which rose in July before decreasing in August, were up sharply (+65.2%) in September. Following a poor harvest in the 2021/2022 crop year, largely because of bad weather conditions, wheat production is expected to increase by more than 50% in the 2022/2023 crop year. This higher production began to have a direct impact on wheat export figures in September. In addition, exports of canola nearly doubled in September, with higher production beginning to have an effect on these exports in September as well.
Exports of energy products increased 1.9% in September, following strong declines in July (-6.9%) and August (-5.4%) that were mainly driven by lower prices. Exports of crude oil (+4.0%) were the largest contributor in September, mainly on higher volumes, as prices decreased for a fourth consecutive month. Natural gas exports (+10.3%) also rose in September. While natural gas prices remained strong in September, higher export volumes contributed the most to the monthly increase. Meanwhile, lower exports of coal (-18.8%) partially offset the gains in the aforementioned categories, mainly on lower volumes. This was a fifth consecutive monthly decrease for coal export values.
Lower exports of metal ores and non-metallic minerals (-11.4%) partially offset the overall increase in total exports in September. Following a significant rise in export values for potash that began in August 2021 and led to a record high in August 2022, these exports fell 16.4% in September. While the recent upward trend in exports of potash was largely the result of higher prices, the September decline was mainly driven by lower volumes. Significant decreases in shipments of potash destined to Brazil and the United States were observed in September. Despite the monthly decline, potash export values have more than doubled compared with September 2021.
Exports of forestry products and building and packaging materials (-4.9%) also decreased in September. Lower exports of lumber and other sawmill products (-14.9%) were mostly responsible for the decline, with both volumes and prices falling. Decreases were observed for this product category in five of the past six months, mainly due to weakening prices. Softwood lumber prices have trended downward since the rise in interest rates began in Canada and the United States.
Pharmaceutical products drive the increase in imports
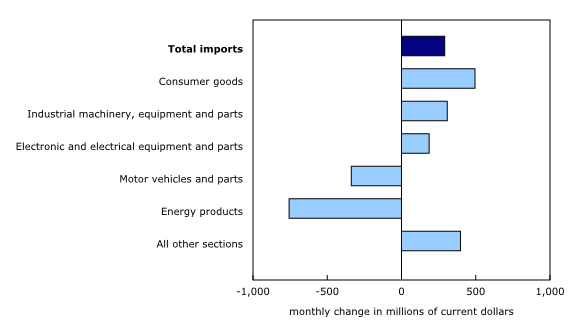
Total imports increased 0.4% in September to reach $65.2 billion. Increases were observed in 6 of the 11 product sections. In real (or volume) terms, however, total imports fell 0.8%.
Imports of consumer goods increased 3.7% in September, on higher imports of pharmaceutical products (+22.7%). In September, a large increase in imports within the category “vaccines for human medicine other than for influenza,” which includes COVID-19 vaccines, was observed. This coincided with the recent availability of updated versions of the COVID-19 vaccine.
Imports of industrial machinery, equipment and parts (+4.1%) rose significantly for a second consecutive month, reaching a record high of $7.7 billion in September. The largest increase came from imports within the subcategory “other general-purpose machinery and equipment,” which rose 5.7% on higher imports of turbines and generator equipment destined for wind farm projects in Alberta. Higher imports of logging, construction, mining, and oil and gas field machinery and equipment (+17.4%) also contributed to the gain in September.
Lower imports of energy products (-16.7%) offset a large part of the increase in total imports. Imports of crude oil and crude bitumen were down 26.0% in September, a third consecutive monthly decline. This decrease was mostly the result of lower volumes, which coincided with maintenance work that took place at some Canadian refineries in September. Imports of refined petroleum energy products (-23.4%) also contributed to the overall decrease, mainly on lower imports of motor gasoline from the United States.
Lowest trade surplus with the United States in 2022
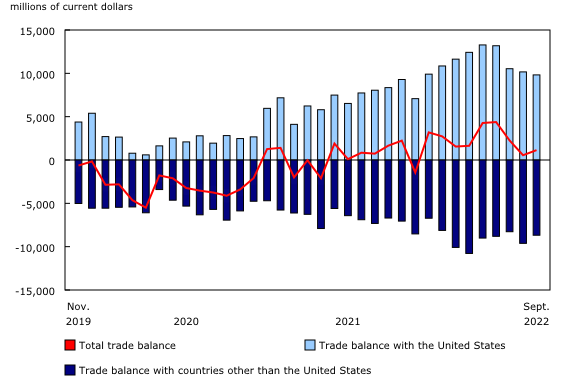
Exports to the United States fell 0.4% in September, a third consecutive monthly decline. At the same time, imports from the United States were up 0.4%. As a result, Canada’s trade surplus with the United States narrowed from $10.2 billion in August to $9.8 billion in September, the lowest surplus since December 2021.
Following a decrease of 3.9% in August 2022, exports to countries other than the United States increased 7.0% in September, the strongest increase since May 2022. Exports to the United Kingdom (gold and crude oil), China (pulse crops, potash and grains) and Hong Kong (gold and crude oil) posted the largest gains.
Meanwhile, imports from countries other than the United States rose 0.5% in September. Higher imports from Italy (industrial machinery), Mexico (various products) and Brazil (metal ores, iron and steel) were partially offset by the decrease in imports from Belgium (pharmaceutical products) and Switzerland (copper).
The merchandise trade deficit with countries other than the United States narrowed from $9.6 billion in August to $8.7 billion in September.
Quarterly nominal exports decrease, while nominal imports increase
In the third quarter of 2022, exports fell 2.3%, the first decline since the second quarter of 2020. Following an increase of 24.7% in the second quarter of 2022, exports of energy products (-5.6%) were responsible for more than two-thirds of the quarterly decrease. Significant declines were observed in crude oil (-5.4%) and coal (-26.5%) exports.
Following an 11.1% increase in the second quarter, the growth in quarterly imports slowed to 0.8% in the third quarter. Higher imports of motor vehicles and parts (+6.0%) and industrial machinery, equipment and parts (+4.4%) were partially offset by lower imports of metal and non-metallic mineral products (-7.1%).
Quarterly real exports increase, while real imports decrease
However, in real terms (calculated using chained 2012 dollars), the results were different. Exports were up 3.3% in the third quarter, the largest increase since the third quarter of 2020. Real exports of energy products (+8.5%), metal ores (+15.8%), farm and food products (+12.5%) and metal products (+6.2%) contributed the most to the gain.
Imports in real terms decreased 0.8% in the third quarter. Lower real imports of energy products (-9.7%) and consumer goods (-1.9%) were partially offset by higher real imports of motor vehicles and parts (+3.6%).
Revisions to August merchandise export and import data
Imports in August, originally reported at $63.9 billion in the previous release, were revised to $64.9 billion in the release for the current reference month. Revisions mainly resulted from a larger number of import transactions that were filed after Statistics Canada’s cut-off for the release of August data. Exports in August, originally reported at $65.4 billion in the previous release, were revised to $65.5 billion in the current reference month’s release.
Monthly trade in services
In September, monthly service exports were up 2.3% to $12.9 billion. Meanwhile, service imports rose 0.5% to $14.5 billion.
When international trade in goods and international trade in services were combined, exports increased 1.5% to $79.3 billion in September, while imports were up 0.5% to $79.7 billion. As a result, Canada’s trade deficit with the world went from $1.2 billion in August to $416 million in September. This was the second consecutive deficit in 2022 for the goods and services combined trade balance.
Source: Statistics Canada
Legal Notice: The information in this article is intended for information purposes only. It is not intended for professional information purposes specific to a person or an institution. Every institution has different requirements because of its own circumstances even though they bear a resemblance to each other. Consequently, it is your interest to consult on an expert before taking a decision based on information stated in this article and putting into practice. Neither Karen Audit nor related person or institutions are not responsible for any damages or losses that might occur in consequence of the use of the information in this article by private or formal, real or legal person and institutions.


